XRP Price Chart Signals Trouble – Is A Drop To $1.20 Possible?
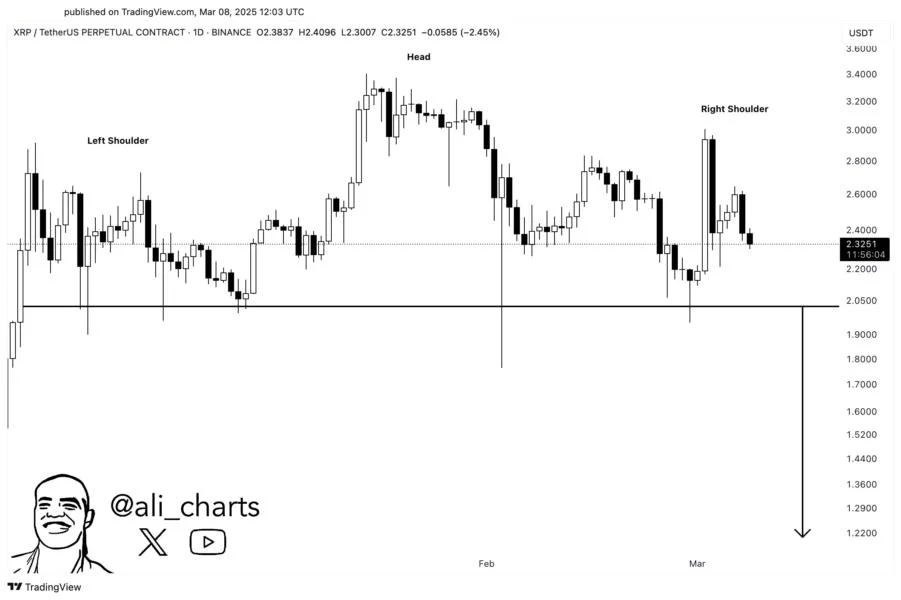
The price of XRP has recorded a significant downtrend in the last 24 hours, declining by almost 5% according to data from CoinMarketCap. Amidst this price fall, renowned market analyst Ali Martinez has stated there is a strong bearish pattern forming on the XRP price chart signaling further price drops ahead.XRP Faces Bearish Breakdown As Head-And-Shoulders Pattern EmergesOver the last week, XRP investors have witnessed both sides of the crypto market volatility after a spontaneous 30% surge to $3.00 was followed by a bearish price action of almost equal strength. Currently, XRP trades at around $2.30 in a downtrend signaling a dominant selling pressure.Commenting on the current state of the market, Ali Martinez stated that XRP’s price action on its daily chart is forming a head-and-shoulders pattern suggesting an incoming heavy price fall. For context, the head-and-shoulders pattern is a common reversal signal, that appears at the peak of an uptrend before a significant downtrend begins.This bearish formation starts with the left shoulder which is an initial price peak followed by a moderate pullback. This can be seen with XRP’s price action in late 2024 after it surged to around $2.70 in early December before the general market correction. Thereafter, there is the head component which represents a higher price peak i.e. the current local market top at $3.40, followed by another decline.Finally, the head and shoulders pattern is completed by the right shoulder formed by XRP’s choppy price action in the last week. The altcoin is now on a downtrend putting many traders on alert for a potential substantial price crash.However, despite the head-and-shoulders pattern, a bearish signal can only be confirmed when XRP breaks decisively below the neckline at $2.20. In this case, Martinez warns the crypto asset could fall as low as $1.20, representing a potential 50% fall from XRP’s local highs seen in February.In neutralizing this bearish projection, XRP bulls must provide enough market demand to push the coin past the right shoulder peak of $3.00, signaling momentum for a prolonged price uptrend.XRP Market OverviewAt press time, XRP trades at $2.34 following a 4.56% decline in the last 24 hours. However, its weekly chart reflects gains of 9.44% pushing the asset into minor monthly gains of 0.34%. The fourth largest cryptocurrency has recently dipped below its 100-day Simple Moving Average correlating with fears of a sustained price fall. However, the XRP community remains largely bullish according to CoinMarketCap data.Related Reading: Bitcoin Price Forecast: LTF Head And Shoulders Pattern Predicts Crash – Here’s The Target