Is XRP price going to crash again?
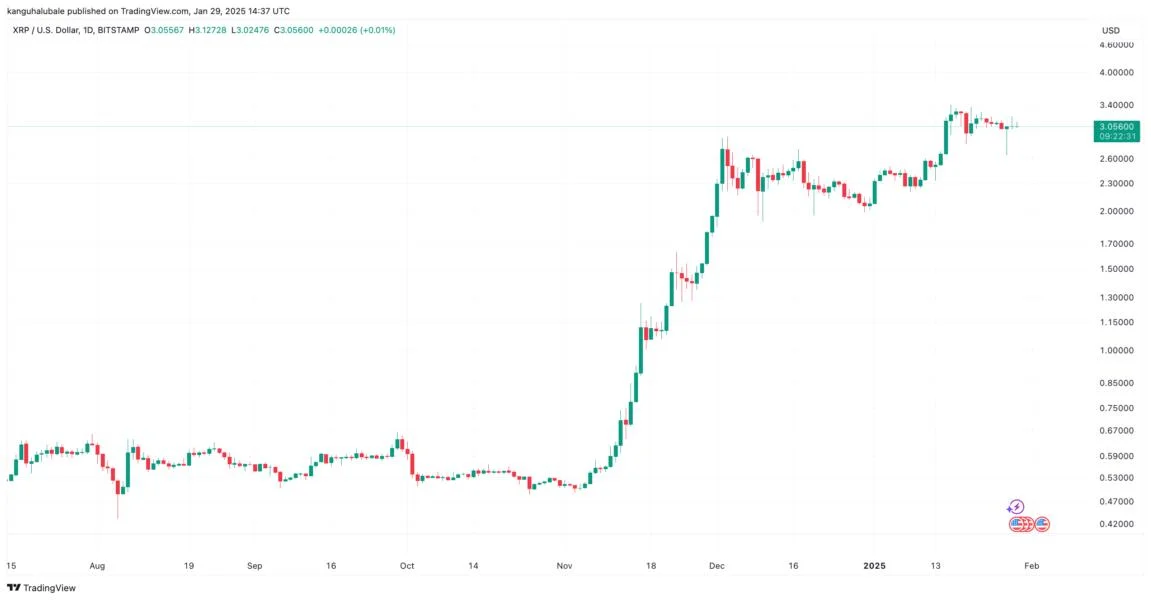
XRP’s price has dropped by 4% over the last day and was trading for as low as $3.02 on Jan. 29.Let’s examine whether XRP’s price could drop further in the coming days.XRP’s symmetrical triangle breakdown means $2.50XRP chart fractal highlights the similarities between the ongoing price trend and that recorded between Dec. 1, 2024, and Jan. 10, 2025, when the price consolidated within a symmetrical triangle. The technical setup suggests a breakout in either direction, with bears eyeing a potential move toward the $2.50 demand zone.Key points to note:Symmetrical triangles, marked by converging trendlines connecting higher lows and lower highs, are considered to be neutral and can signal either a bullish or a bearish situation. A breakout from the pattern in either direction signals a new trend.As of Jan. 10, XRP is trading near the triangle’s lower trendline, which, if breached, could lead to deeper corrections. This means a decline toward the 50-day exponential moving average (EMA, the yellow wave) at $2.57 or the bearish target of the triangle at $2.50.This would represent about an 18% drawdown from the current price levels.This downside target is measured after subtracting the triangle’s maximum height from the potential breakdown point at the triangle’s lower trendline at $3.00.Conversely, a clear break above the triangle’s upper trendline could send XRP toward $3.75, measured by adding the triangle’s maximum height to the potential breakout point at around $3.20.However, XRP’s market favors the bears, primarily due to signs that the number of wallets holding XRP has been on a downward trend for over a month now.The data shows: XRP active addresses have dropped from a three-year high of 108,771 on Dec. 2, 2024, to 40,292 on Jan. 28. This metric has declined by over 39% over the last 10 days alone, accompanying an approximately 10% price drop over the same period.This implies that XRP holders have been booking profits following the rally to seven-year highs of $3.40.If the trend continues, XRP price could drop lower before initiating another recovery.XRP price upside hopes remain intactXRP, nevertheless, remains in line with a bullish continuation pattern that indicates a potential rebound ahead despite the ongoing consolidation.Key points:XRP still trades within a bull flag pattern, indicating the possibility of regaining bullish momentum if key support levels hold.The bull flag developed after XRP’s rally from $2.27 to a local high of $3.40 between Jan. 10 and Jan. 16.The consolidation within the bull flag has XRP trading in a descending parallel channel, with today’s recovery nearing critical support levels, including the upper boundary of the flag at $3.30.A breakout above this level could trigger another rally.The bull flag’s upside target, derived from the height of the previous rally, is approximately $4.60, representing a 52% uptick from the current price.This article does not contain investment advice or recommendations. Every investment and trading move involves risk, and readers should conduct their own research when making a decision.