How high can XRP price go?
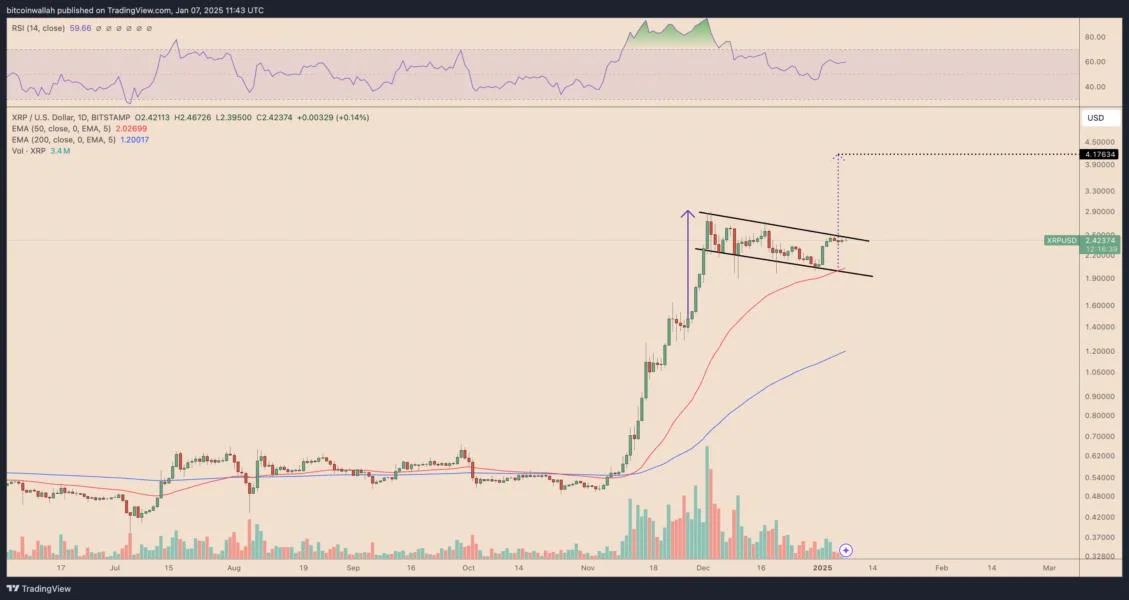
XRP has erased the losses from the beginning of 2025, rebounding by over 30% following its monthly low to reach $2.89 on Jan. 15, its highest level in six years. The cryptocurrency’s climb aligns with “enormous” accumulation by whales, primarily those who hold between 1 million and 10 million tokens. Its upside prospects have also been boosted by a JPMorgan analyst’s prediction, saying that US XRP ETFs could attract $4 billion to $8 billion in net new assets if approved.The upcoming inauguration of President-elect Trump on Jan. 20 could serve as a major catalyst for XRP, potentially paving the way for the approval of spot XRP ETFs in the US.Positive fundamentals suggest XRP may climb further in 2025, with technical outlooks suggesting the same.Bull flag setup could result in XRP price rising 50%XRP’s price has entered the breakout stage of its prevailing bull flag pattern on the daily chart, characterized by a downward-sloping channel after the cryptocurrency’s 105% increase in November and December.XRP is now trading near $2.72 above the pattern’s upper boundary. According to technical analysis, this breakout move could pave the way for further upside, targeting the level at a length equal to the previous uptrend’s height.This projection points to a move toward $4.16, indicating a possible 50% rally by February from current levels.Technical indicators support the bullish thesis. XRP’s relative strength index (RSI) sits near 66, suggesting sufficient room for upward momentum.Meanwhile, the price remains above its 50-day exponential moving average (50-day EMA; the red wave) around $2.15, reinforcing the case for a breakout as the EMA acts as a strong support level.XRP weekly chart hints at double-digit prices aheadXRP’s ongoing price rally has pushed it into the breakout stage of its bull pennant pattern on the weekly chart.Bull pennants form when the price forms a triangle-like consolidation structure after a strong move upward. It resolves when the price breaks above the upper trendline and rises by as much as the previous uptrend’s height. As a result, XRP’s bull flag pattern suggests a measured move target near $13-$14 in the coming weeks or months, based on the flagpole height projected from the breakout point. That amounts to approximately 370% upside from the current price levels.The bullish momentum aligns with XRP trading well above key moving averages, including the 50-week EMA ($1.64) and 200-week EMA ($0.69), highlighting strong market support. Fibonacci extension levels reinforce the $3 and $4.62 ranges as intermediate resistance points, with the breakout target at the 4.618 Fibonacci level near $13.However, with the Relative Strength Index (RSI) at 79.5, XRP is in the overbought zone, which could lead to a short-term correction or consolidation.XRP’s 2017 fractal points to $18 target — AnalystXRP’s monthly chart highlights a “confirmed uptrend breakout,” according to X-based chartist Dark Defender.The analyst’s upside outlook takes cues from XRP’s breakout trends during the 2017 bull market, during which the cryptocurrency posted 1,022% gains. He also expects that will rise toward $10.2252 and then $18.2275 in the short term.The upside targets are measured according to XRP’s Fibonacci retracement levels achieved during the 2017 bull run. This article does not contain investment advice or recommendations. Every investment and trading move involves risk, and readers should conduct their own research when making a decision.XRP (XRP) has erased the losses it witnessed at the beginning of 2025, rebounding by over 30% from its monthly low to reach $2.89 on Jan. 15, its highest level in six years.The cryptocurrency’s climb aligns with “enormous” accumulation by whales, primarily those who hold between 1 million and 10 million tokens. Its upside bias has improved following JP Morgan analyst’s prediction, saying that US XRP ETFs could attract $4 billion-to-$8 billion in net new assets if approved.The upcoming inauguration of President-elect Trump on Jan. 20 could serve as a catalyst for XRP, potentially paving the way for the approval of spot XRP ETFs in the US.Positive fundamentals suggest XRP may climb further in 2025, with technical outlooks suggesting the same.Bull flag setup could result in XRP price rising 50%XRP’s price has entered the breakout stage of its prevailing bull flag pattern on the daily chart, characterized by a downward-sloping channel after the cryptocurrency’s 105% increase in November and December.XRP is now trading near $2.72, already above the pattern’s upper boundary. This breakout move could pave the way for further upside, targeting the level at a length equal to the previous uptrend’s height, per the rule of technical analysis.This projection points to a move toward $4.16, indicating a possible 50% rally by February from current levels.Technical indicators support the bullish thesis. XRP’s relative strength index (RSI) sits near 66, suggesting sufficient room for upward momentum.Meanwhile, the price remains above its 50-day exponential moving average (50-day EMA; the red wave) around $2.15, reinforcing the case for a breakout as the EMA acts as a strong support level.XRP weekly chart breakout suggests $13 price target in 2025XRP’s ongoing price rally has pushed it into the breakout stage of its bull pennant pattern on the weekly chart.Bull pennants form when the price forms a triangle-like consolidation structure after a strong move upward. Meanwhile, it resolves when the price breaks above the upper trendline and rises by as much as the previous uptrend’s height.As a result of this technical rule, XRP’s bull flag pattern suggests a measured move target near $13 in the coming weeks or months, based on the flagpole height projected from the breakout point. That amounts to approximately 370% upside from the current price levels.The bullish momentum aligns with XRP trading well above key moving averages, including the 50-week EMA ($1.64) and 200-week EMA ($0.69), highlighting strong market support. Fibonacci extension levels reinforce the $3 and $4.62 ranges as intermediate resistance points, with the breakout target at the 4.618 Fibonacci level near $13.However, with the Relative Strength Index (RSI) at 79.5, XRP appears overbought, which could lead to a short-term correction or consolidation.XRP fractal suggests $18 price target — AnalystXRP's monthly chart highlights a “confirmed uptrend breakout,” according to X-based chartist Dark Defender.The analyst’s upside outlook takes cues from XRP’s breakout trends during the 2017 bull market, during which the cryptocurrency posted 1,022% gains. He added that the cryptocurrency will likely “proceed towards $10.2252 and then $18.2275 in the short term.”The upside targets are measured according to XRP’s Fibonacci retracement levels achieved during the 2017 bull run.This article does not contain investment advice or recommendations. Every investment and trading move involves risk, and readers should conduct their own research when making a decision.