Ethereum Price Analysis: What’s Ahead for ETH After a 9% Weekly Dip?
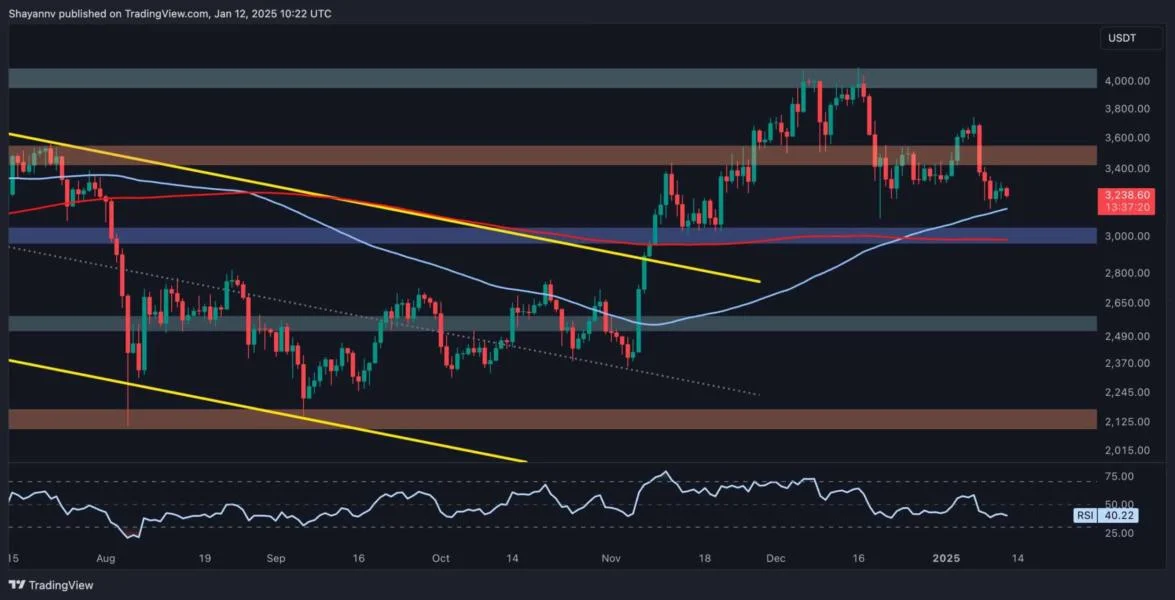
Ethereum currently rests at a notable support region near $3.2K, with market participants closely observing the potential for a bullish rebound.The Funding Rates metric offers valuable insights into the sentiment within the perpetual futures markets, helping to gauge the likelihood of a recovery.Technical AnalysisBy ShayanThe Daily ChartEthereum has seen consistent declines following its rejection at the $4K resistance level, indicating the dominance of sellers. Most recently, another sharp decline pushed the price toward a substantial support zone, defined by the 100-day moving average of $3.1K.This dynamic support is critical as demand concentration near this region is expected to curb downward momentum, with a bullish rebound being plausible if buying interest emerges.Currently, ETH is trapped between the 100-day MA ($3.1K) and the $3.5K resistance level, forming a tight consolidation range. A decisive move in either direction will likely determine the mid-term trend.The 4-Hour ChartOn the 4-hour timeframe, Ethereum broke down from an ascending wedge pattern, a bearish structure that typically signals further declines. This breakdown triggered a swift sell-off, pushing the price toward a support zone defined by the 0.5-0.618 Fibonacci retracement levels.This support zone has the potential to stabilize the price and possibly initiate a short-term bullish rebound. However, persistent bearish pressure could result in a break below this line, intensifying the downtrend.If Ethereum breaches this critical support zone, it may trigger panic selling, further strengthening sellers’ dominance. Conversely, a sustained rebound could pave the way for a recovery toward the $3.5K resistance level.Onchain AnalysisBy ShayanExamining the chart, the recent market correction has coincided with a significant decline in funding rates. This shift suggests growing bearish sentiment among speculators, with many traders betting on further decreases in ETH’s price.However, upon reaching the substantial support zone at $3K, the Funding Rates metric has started to show signs of recovery. A notable bullish spike in the metric suggests an influx of buying interest as market participants begin to open long positions in anticipation of a price rebound.If this recovery in funding rates continues, it could indicate sustained demand and the potential for a bullish rebound from the $3K support. On the other hand, if the current recovery loses momentum or reverses, it would signal a return to bearish sentiment, paving the way for a deeper correction.