Dogecoin On The Edge: Major Breakout Or Breakdown Imminent?
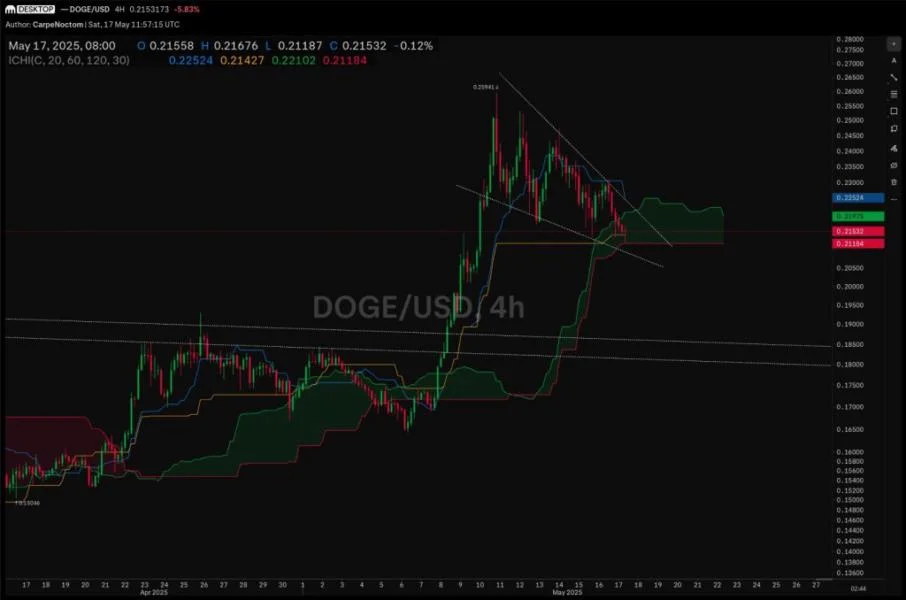
The Dogecoin price could be at a critical juncture for a breakout but momentum needs to persist.On the four-hour chart shared by analyst Josh Olszewicz, price has been sliding inside a clearly defined falling-wedge formation since printing a local high at $0.25941 on 13 May. The upper and lower boundaries of that wedge continue to drift lower, trapping successive swing highs and lows; the lower rail is presently guiding support at while the upper rail caps the market near $0.219.Within that compression, Olszewicz overlays an Ichimoku system set to short-cycle parameters (20/60/120/30). The most recent completed candle — stamped 17 May 08:00 UTC — settled at $0.21532 after trading between $0.21187 and $0.21676. That close left price lodged squarely inside the cloud, a location that typically denotes equilibrium. Internally, the Tenkan-sen rests at $0.21427, the Kijun-sen at $0.22524, Senkou Span A at $0.22102 and Senkou Span B at $0.21184, creating an unusually tight band of short-term reference levels.The zone between the wedge floor and Span B around $0.212–0.214 forms a high-confluence support zone that has already produced two intraday rebounds. Conversely, the Kijun-sen and descending wedge resistance intersect near $0.225, erecting an equally visible ceiling overhead. As long as price remains trapped between those two lines, momentum traders are likely to see a low-volatility coil; the first decisive breach — particularly a four-hour close through the upper rail — would satisfy every textbook criterion for a bullish falling-wedge resolution and mechanically projects a return toward the 13 May high.Dogecoin Looks Still StrongCantonese Cat’s weekly perspective speaks to a larger cycle. In his chart, Dogecoin has just finished its first weekly close above the Bull Market Support Band — essentially the 20-week simple moving average enveloped by a two-sigma envelope — since early February. That band currently spans $0.21617 at the lower edge to $0.22378 at the upper edge; last week’s candle settled at $0.22387, a whisker above the cap, converting what had been resistance throughout the spring into provisional support.The break occurs while the Bollinger upper band is still descending from the February crest near $0.35, an indication that volatility on the weekly time-frame has only just begun to contract after a multi-month bear unwind. The midline of the Bollinger structure, identical to the 20-week SMA and the top of the Bull Market Support Band, is therefore the single most important pivot for the week ahead.A second consecutive weekly settlement above $0.22378 would confirm the first as more than a one-off spike and could embolden trend-followers to price in a medium-term push toward the mid-$0.30s where the upper band presently curves.Taken together, the two time-frames sketch a clear roadmap. Short-term traders will be looking for a resolution of the descending wedge; a bullish breakout through $0.219 would immediately shift focus to prior supply at $0.24-0.26, whereas a failure to hold $0.205 risks an acceleration toward the April pivot at $0.185.At press time, DOGE traded at $0.217.