Back to News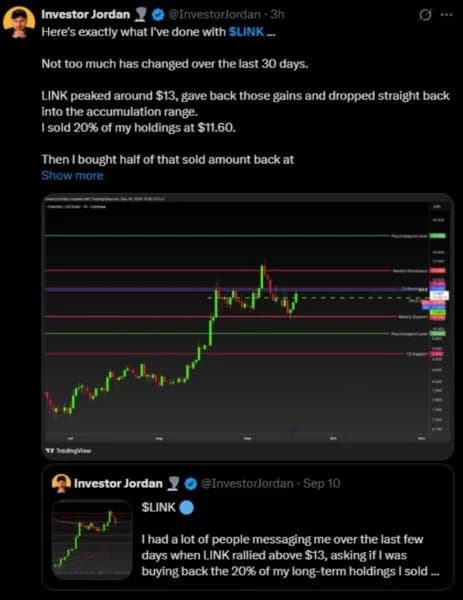
Chainlink Price Rebounds 6% as LINK Tests the $12 Resistance Zone
BraveNewCoin data places LINK at $12.11, up 6.21% over 24 hours.The token traded between $11.25 and $12.22, while reported volume stood near $538.65 million. LINK now faces after recovering from support around the $11 area.The daily and longer-term charts show two different tests developing. The shorter chart tracks resistance between roughly $12 and $13. Meanwhile, the multi-year chart shows LINK approaching a descending trendline dating from its previous market peak.LINK Returns to the $12 Resistance AreaThe analyst chart shows LINK recovering after dropping back into an accumulation range following its earlier move toward $13.Price recently bounced from weekly support around the $10.70 to $11 area. LINK has since moved back toward a cluster of daily resistance levels near $12.Investor Jordan's chart places a higher weekly resistance area around $12.80 to $13. LINK previously reached that region before surrendering its gains and returning to the range. Source: XThat leaves $12 as the first short-term test. A sustained move above the nearby daily resistance would bring the previous $13 area back into view.The chart also maps a psychological level at $15 above the weekly resistance. On the downside, $11 forms the nearest support area, followed by the psychological $10 level.A deeper move would expose daily support near $9.20 on the same chart.LINK Volume Rises With 6% Price RecoveryBraveNewCoin data provides the latest market picture. LINK trades at $12.11, while its 24-hour high stands at $12.22. The day's low sits at $11.25, showing that price recovered nearly $1 from the session bottom.Chainlink's market capitalization stands near $9.06 billion, with approximately 748.10 million LINK in available supply. Source: Reported 24-hour trading volume stands around $538.65 million. The price remains about 77% below its $52.70 all-time high, according to the same data.The intraday chart shows a steady climb from around $11.25 before price moved above $12 during later trading.This recovery puts LINK back near the resistance cluster shown on the first chart rather than confirming a breakout above it.Long-Term LINK Trendline Comes Into FocusAnother analyst chart shifts attention to Chainlink's longer-term structure. A monthly chart shared on X shows a descending resistance line extending from LINK's 2021 peak through subsequent lower highs. The price is now trading close to that trendline.The chart shows a second declining line tracking more recent highs. Together, the two lines place LINK near a long-term technical boundary after several years of lower price peaks. Source: Quinten va XThe analyst behind the chart says the three-week structure has already turned bullish while the monthly structure is approaching a similar change. That interpretation has not yet produced a confirmed break of the descending resistance visible on the chart.LINK therefore enters the latest session with $12 to $13 as the immediate resistance area. The longer-term chart places additional attention on whether price can move beyond the multi-year descending trendline while holding the recent recovery above $11.