Back to News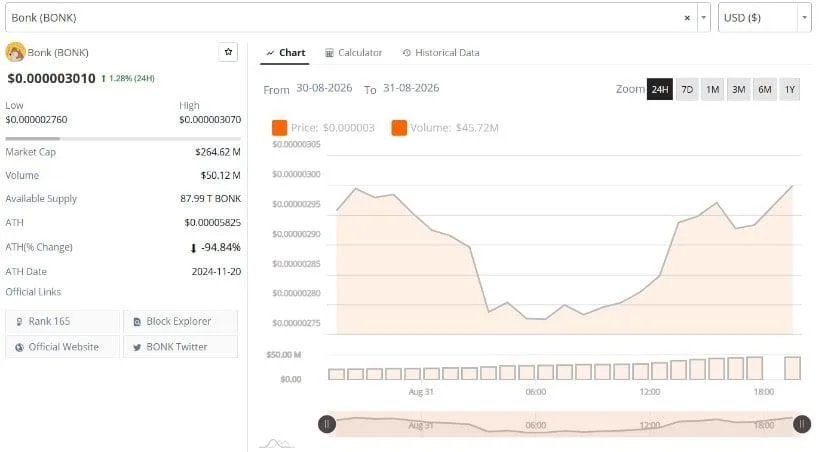
BONK Price Analysis Shows Recovery Toward $0.000003 Resistance
By Exbasi Intelligence
Sourced from Brave New CoinThe market data chart reveals that BONK's has been focused below the previous resistance area and is trading up by +1.28%over the past 24 hours.Meanwhile, the three charts analyzed indicate BONK is trading within a short-term recovery structure. The token has recovered from the lower range near $0.00000276 and is now testing levels around $0.00000300-$0.00000307.BONK Price Recovers From Intraday Support LevelsNotably, the BraveNewCoin market chart shows BONK trading between a daily low of $0.00000276 and a high of $0.00000307. The price opened the session at the top of the $0.0000029 range but then faded back to the lower support level.BONK's lowest point was around the price of $0.00000276 before the price picked up again during the second half of the session. The recovery pushed the price back above $0.00000290 and toward the $0.00000300 area.The figure indicates that the downtrend is over and the market is getting more stable. Price has stayed above the price of the bottom of the day and has been moving closer to the price of the top of the day.Trading volume on its chart is close to $45.72 million, while the market data indicates that BONK's market capitalization is around $264.62 million. Source: The current structure places $0.00000276-$0.00000280 as the first support area. This was the area that was the base for the recovery and was the zone of the latest pullback.BONK Tests Resistance Around $0.00000300Even so, the X chart signifies that BONK has consolidated within a downward trend and is looking to make a recovery. Price broke from the lower bound just shy of the figure of $0.00000257 and returned towards the area of $0.00000300.The resistance line has a tendency to move down and has, over the recent period, an upward tendency that is limited. BONK is currently testing that trendline.Support level $0.00000280 is also located below the chart. This level has served as a benchmark in the recent consolidation. Source: Honey Via XThe latest candles show the price moving around $0.00000295-$0.00300. The token is trying to pull back above the downward resistance trendline on the chart.The next resistance area appears near $0.00000303-$0.00000310. If the price moves above this zone, the previous higher price levels around $0.00000326 would be brought into sight.TradingView Shows Mixed Momentum SignalsBONK is currently approaching the $0.00000300 level, as seen on the TradingView chart, following a prior trend toward that price point. The price rallied steadily throughout the session until settling near resistance.Several Bollinger Band signals near the recent range are shown. These signals were formed when BONK bounced between support and resistance levels. Source: The latest reading of the Chaikin Money Flow indicator is -0.36. The indicator has broken below the zero line, having been above it for earlier periods of the session.The negative CMF reading indicates lower money flow at the latest time. The BONK price, however, is staying above the intraday support zone and maintaining prices around the top of the trading range.Volume activity also has to be considered in the upward direction of the chart, where it shows that volume is active during certain periods. Since then, price has been in a consolidation period around $0.000003.BONK Price Analysis Tracks Next Key Levels.Meanwhile, the current BONK price structure is defined by the $0.00000280 support area and the $0.00000300-$0.00000307 resistance zone.If the price makes a move above the $0.00000307 level, the next resistance would be around $0.00000326 as per the X chart structure. Above that area, the chart shows the previous high zone near $0.00000349-$0.00000367.If BONK loses the $0.00000280 support, the next visible downside level is around $0.00000257-$0.00000260** from the X chart.The market data chart indicates that BONK is trading at much lower levels than it has recorded previously, with the current price level being about 94% lower than the all-time high.On all three charts, BONK is in the vicinity of a short-term recovery area. Price action is playing around the $0.00000300 resistance zone and will need to overcome this level to maintain the previous support levels.