Back to News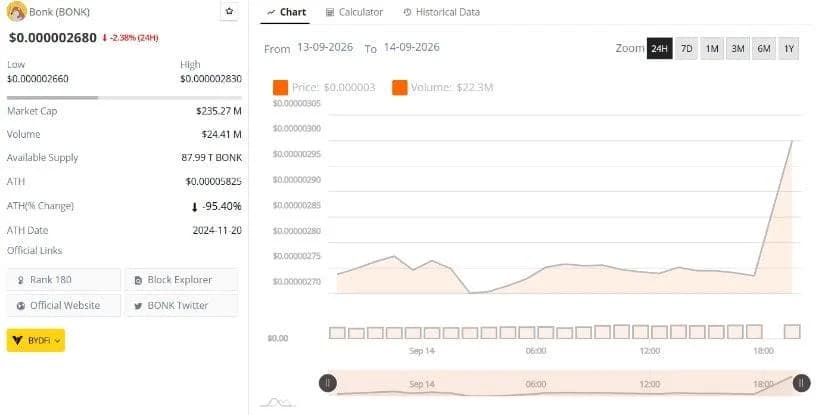
BONK Price Analysis: Selling Pressure Builds as $0.00000265 Support Comes Into Focus
The three charts show BONK around $0.00000267, with the momentum indicators displaying that sellers dominate the field.Notably, the ongoing issue now is whether BONK can clear the $0.00000265-$0.00000266 zone or rally back above the $0.00000270 resistance level.Market Data Shows BONK Near Daily SupportBraveNewCoin places BONK near $0.000002680, down about 2.38% over 24 hours. The token traded between approximately $0.000002660 and $0.000002830 during the period.That swath, combined with the inability to hold onto earlier gains, brings BONK down to near-daily lows in the range. As a result, $0.000002660 is the closest support to which the data is showing.Market cap is near $235.27 million, and 24-hour trading volume is about $24.41 million. Supply: approximately 87.99 trillion BONK. Source: Failure to break above would continue the day's weakness. The upper end of the range, around $0.000002830, is the primary support point of the BraveNewCoin data. For BONK to take a swing at that area, it would need to get a bit stronger.That token is still well off the highs it had reached, however. Market data has experienced a decline of approximately 95.40% since its all-time high of $0.00005825 in November 2024.Technical Signals: Weak Short-Term Money FlowThe price of BONK has been consolidating around $0.00000267 over the last few hours as it continues its downward trend from above $0.00000280, as per the TradingView chart.Price started to make higher lows during the day and then settled at $0.00000265-$0.00000267. There have been a few short-term rebounds there, and it is the closest rebound zone that is visible.The Chaikin Money Flow reading, on the other hand, is around -0.36. The selling pressure has been greater than the buying pressure over the period of time being measured. Source: There are also a variety of Bollinger Band strategy signals on the chart. In the short term, there are plenty of buy and sell signals indicating that momentum has reversed several times intraday, despite the current downward trend.The initial hurdle for BONK is just over $0.00000270. A stronger rebound would bring the $0.00000275–$0.00000280 region back into focus.The downside would be a loss of $0.00000265, which would put pressure on the current stabilization effort and draw new focus to the lower intraday levels.CoinGecko Data Confirms 24-Hour BONK DeclineMeanwhile, CoinGecko offers a similar view of BONK, which is currently trading around $0.000002667, slipping 2.7% in the past 24 hours. Its displayed range runs from roughly $0.000002651 to $0.000002828.The 24-hour chart indicates that price has been making repeated attempts to break above that range but is pointing to the upper levels in order to turn around. Source: CoingeckoDataBONK then fell steadily and came close to the bottom of the session, only to bounce back a little.That structure supports $0.00000265 as immediate support, and $0.00000270 is the first level BONK would have to retake.According to CoinGecko, BONK's market cap is close to $234.76 million, while its 24-hour trading volume is $24.59 million. TVL is currently around $10.71 million.Both the circulating supply and the total supply are displayed at around 87.994 trillion BONKs. In the face of the recent slide, the three charts maintain short-term attention on the $0.00000265 support and a potential recovery above $0.00000270.
More crypto intelligence
- Regulatory Crossroads and Security Breaches Temper Bitcoin Momentum
- Asian markets make shaky gains ahead of Fed decision, oil slips
- CLARITY Act Hits A Senate Wall: Crypto CEOs Furious, Senators Defend ‘No’ Votes — Some Analysts Say Fight Isn't Over
- ViaBTC Partners with Mempool to Expand Access to BTC Transaction Acceleration Services