Back to News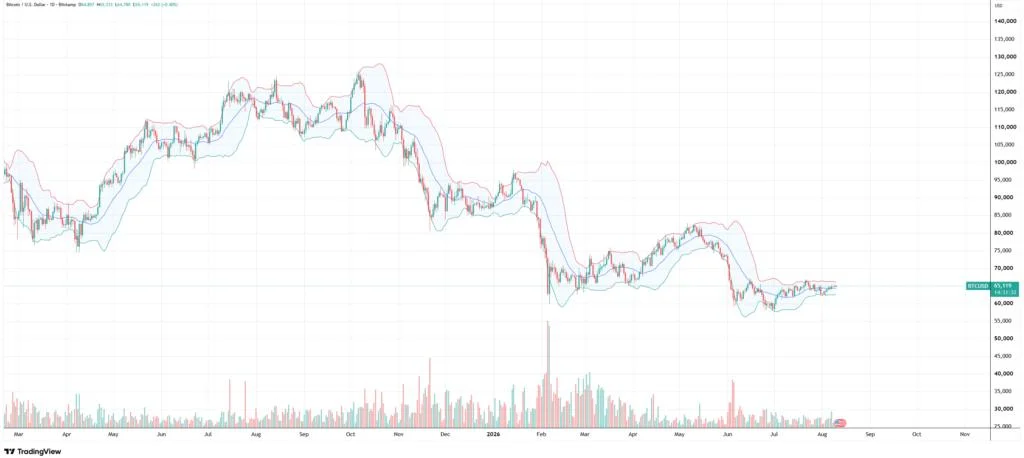
Bitcoin Looks Dead Quiet—Until You Look Under the Hood
By Exbasi Intelligence
Sourced from BenzingaBitcoin’s lethargic summer has put the cryptocurrency market into a deceptive lull. The most popular coin has been dormant, hovering around the $65,000 mark. Yet, the hibernation is masking a market that may be easier to move.According to the Kobeissi letter, daily spot turnover across 44 exchanges has collapsed to about $15 billion per day, or about 70% below January’s peak. Fresh commitments might be waiting for clarification of monetary policy or progress on the .Thus, the market is increasingly looking like a coiled spring, as muted participation brought compressed price action. But a thinner order book means that even relatively modest flows could set off an outsized rally or trigger a cascade of liquidations.Observing the Breakout RiskBitcoin’s daily trading range is the narrowest since January. The coin is down for the year, with the largest ETF, iShares Bitcoin Trust ETF ), losing around 27.7% year-to-date.Bollinger band width, a gauge of the distance between volatility bands around the price, has declined, as evident from the daily chart.Bitcoin daily chart with Bollinger bands, Source: TradingViewSuch conditions have made momentum trades scarce and left range traders competing for smaller moves.Derivatives activity tells a similar story. Bitcoin perpetual-futures volume on Binance recorded its sixth-lowest daily reading in five years on Aug. 8, for the dominant derivatives venue. The slowdown followed a July period when Binance futures turnover exceeded $57 billion, and the futures-to-spot ratio reached about 7.8 times.The direction of any break is difficult to predict, but low volume changes the market mechanics. Technical levels become weaker, and leverage can accelerate a move if liquidations begin.January’s consolidation shows an example when, after a tight range, the coin surged to $98,000 and then declined to near $60,000. Quiet phases have repeatedly proved temporary.Flows Find Equilibrium at Depressed LevelsInstitutional and derivatives indicators point to temporary balance, not renewed conviction. Charles Schwab quoted Glassnode data showing how spot Bitcoin exchange-traded products have found equilibrium after heavy selling in late May and June (including around $4.6 billion of June net outflows).Futures open interest has stabilized, turning positive on July 4, although aggregate activity remains subdued and without a long or short bias. The put-call ratio rose to 0.61 by Aug. 1 from 0.51 on July 24, indicating increased demand for downside protection.Other measures show the drag is structural. Spot volume measured in Bitcoin, rather than dollars, has fallen to its lowest level since 2019. Corporate Bitcoin treasury additions totaled 5,237 coins in July, the weakest monthly reading since February.Seasonality May Prolong the LullYet, seasonal trends offer little encouragement. Barchart’s data shows that, on average, August posts a 0.63% loss, with only 37.5% of historical Augusts finishing higher. September has been Bitcoin’s weakest month, averaging a 4.15% decline and a median drop of 1.91%.Although those tendencies are not forecasts, with macro-policy decisions and legal clarity still in the air, seasonal caution could keep liquidity thin through the third quarter. In turn, the eventual move in either direction could be more consequential.Image via Shutterstock