Back to News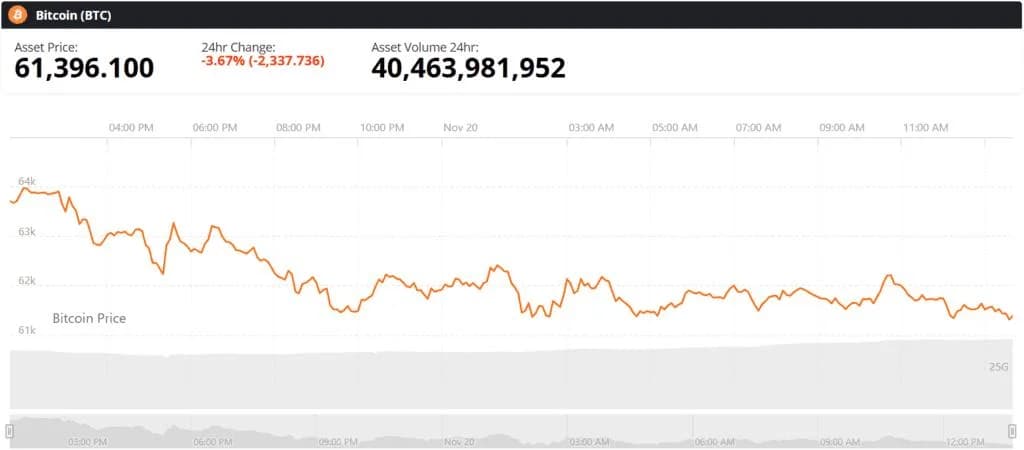
Bitcoin (BTC) Price Today: Glassnode Warns of Holder Losses as BTC Approaches Critical $61K Support
Glassnode data also points to a shrinking profit margin for the average Bitcoin holder, raising concerns that another decline could push the market into an unrealized-loss phase.Fundamental AnalysisBitcoin faced several sources of selling pressure during the November 17–19 period. US spot Bitcoin ETFs recorded combined of approximately $1.13 billion, suggesting that institutional demand weakened as market conditions deteriorated. Expectations of a tighter Federal Reserve stance and weakness across technology stocks added to the cautious mood surrounding risk assets.Bitcoin (BTC) price chart. Source: Derivatives activity further intensified the decline. CoinGlass recorded approximately $201.51 million in Bitcoin derivatives liquidations over the preceding 24 hours. Long positions accounted for $167.97 million, compared with $33.55 million in short liquidations. The imbalance indicates that traders positioned for higher prices absorbed most of the losses as BTC continued to fall.The average funding rate also turned slightly negative, reflecting a shift in derivatives positioning. However, the liquidation figures do not yet establish that the market has reached a capitulation phase. Instead, they show that bullish positions faced greater pressure during the latest decline.Liquidity conditions provide another concern. The shrinking supply of stablecoins points to a weaker pool of available capital across the crypto market. With ETF withdrawals accelerating and liquidity declining, Bitcoin may struggle to sustain a recovery without renewed spot demand.Glassnode Highlights a Narrow Profit MarginOn-chain data from Glassnode shows that Bitcoin remains above its realized price, meaning the average holder is still marginally in profit. However, the MVRV ratio, which compares Bitcoin's with its realized value, has moved close to the breakeven level of 1.The chart highlights MVRV hovering near breakeven 509 days before the projected April 2028 Bitcoin halving, mirroring patterns observed in previous pre-halving cycles. Source: Glassnode via XThe reading is particularly significant because it suggests that the average investor has limited unrealized gains to absorb further price declines. As of November 2026, the MVRV ratio was only slightly above 1, leaving holders increasingly exposed to a move below their aggregate cost basis.A fall beneath that threshold would place the average Bitcoin holder in an unrealized-loss position for the first time since early 2023. Such a shift could increase selling pressure, particularly if investors decide to reduce exposure rather than wait for a potential recovery.Glassnode's historical comparison also places the current reading approximately 509 days before the estimated April 2028 Bitcoin halving. Previous market cycles experienced periods when MVRV approached breakeven levels ahead of their respective halvings. However, the indicator alone does not establish whether the current market will follow the same pattern.Technical AnalysisBitcoin's technical structure remains firmly bearish despite signs that the market may be approaching an oversold condition. TradingView's Bitstamp feed placed BTCUSD near $61,368 in the latest available snapshot, representing a decline of approximately $2,396, or 3.76%.BTCUSD has reached the lower boundary of a previous support zone, with oversold RSI and an extended gap from the EMA stack indicating potential for a modest rebound. Source: on TradingViewThe aggregated showed 14 sell signals, nine neutral readings and only three buy signals. Moving averages accounted for most of the negative readings, with 13 sell signals against one neutral and one buy. This configuration reflects the extent of the recent decline and confirms that the remains below its major trend indicators.The Relative Strength Index (RSI) stood at 20, placing it deep in oversold territory. The Stochastic indicator also dropped to 3, while the Williams Percent Range reached -99. These readings suggest that selling has become unusually intense over the short term.Other indicators present a mixed picture. The Commodity Channel Index (CCI) generated a buy signal at -117, while Momentum also indicated a possible rebound. However, the MACD remained bearish at -4,596, and the Average Directional Index (ADX) stood at 43, indicating that the prevailing trend remains strong.The moving-average structure reinforces the downside bias. The 10-day exponential moving average (EMA) was near $65,713, while the 20-day EMA stood around $69,611. Longer-term averages were also considerably higher than the current market price. This wide separation indicates that Bitcoin has experienced substantial downward momentum and would need sustained buying interest to reclaim those levels.$61K Support Remains CriticalThe immediate focus is on Bitcoin's ability to defend the $61,000 area, which coincides with a major daily demand zone identified in the TradingView analysis. The sharp bearish impulse has brought BTC close to this region, making its reaction there important for determining the next short-term move.The deeply oversold indicators and the distance from the major moving averages leave room for a relief bounce. However, oversold conditions do not guarantee an immediate reversal, particularly when the broader trend remains negative.According to eLs-Trading on TradingView, traders should avoid trying to identify the exact bottom and wait for confirmation before acting around the demand zone. The analysis states: "Never chase or predict the bottom. Always wait for clear confirmation signals to validate the zone before entering."If Bitcoin stabilizes above $61,000, the first important upside reference is around $65,500. A recovery toward $69,000 would represent the next resistance test. A sustained move above that level could improve the technical structure, although the broader moving-average configuration would still require attention.Conversely, a decisive break below $61,000 could expose the previous low near $57,700. The classic S3 pivot level around $58,181 provides another downside reference within the same broader price region.For now, Bitcoin's near-term direction depends on whether buyers can defend the $61,000 support area and generate enough demand to counter continued selling. Improving ETF flows and stronger spot-market participation would provide clearer evidence of recovery. Without those developments, the combination of weak liquidity, negative market sentiment and bearish moving averages continues to leave the BTC price vulnerable to further declines.